
Google BigQuery is a powerful data warehouse used by enterprises. It can store and query large amounts of data without lagging, which is why so many agencies benefit from using it.
If you are working with data coming from various sources, such as social media platforms, Google Ads, Looker Studio, and more, you’ve known the pain of working with dispersed data.
It’s a challenge not worth undertaking because it will take you hours or days to compare all the data manually. That’s when it’s time to build an SSOT, which can be a BigQuery data warehouse, and gather all your useful data in one place.
BigQuery is popular because of its capability to efficiently query billions of rows. And if you’ve never worked with BigQuery before, you might be hesitant to try it out. In this BigQuery tutorial, we’ll go over the top BigQuery features, its data structure, and how to get started by creating your first table. Let’s get started!
What is Google BigQuery?
Before we get started with our BigQuery tutorial, let’s first learn about the solution. Google BigQuery is a fully managed data warehouse with a lightning-fast query engine that makes it easy to look through data that is stored or connected. It handles queries that go through petabytes of data in minutes, and it’s capable of storing exabytes of data, making it a perfect option for your big data needs.
BigQuery, which is part of the Google Cloud Platform, is completely serverless and can interpret both legacy and standard SQL queries. However, standard SQL is its official query language.
BigQuery works best with read-only actions on datasets, and thanks to its built-in cache, it operates super fast on data that isn’t frequently updated. You’ll find that BigQuery is used at the end of ETL pipelines because it works well with data that’s already been processed.
5 Key Features of Google BigQuery
BigQuery is perfect for running analytical queries, but that doesn’t mean that it should replace your relational databases entirely. However, when it comes to storing and analysing data, BigQuery ranks among the best tools, and these BigQuery features explain why:
#1. Lighting Fast Data Querying
Speed is one of the strongest suits of BigQuery. Compared to traditional systems that take long periods of time to process simple queries, BigQuery can sort through petabytes of data within minutes. That means you can query through billions of rows without worrying about speed or performance.
At the core of BigQuery lies the efficient query execution engine, Dremel. By combining a tree architecture with columnar data layouts, Dremel is capable of processing so many rows in just a few seconds, which is hard to find in other data warehousing services.
#2. High-Security Level
When using BigQuery, you should know that you’re using a platform that focuses on keeping your data safe. Your data in BigQuery is encrypted and protected both when it’s moving and when it’s stored. To eliminate security risks, all of your data will be automatically encrypted using the AES 128 standard.
That means even in the worst-case scenario of BigQuery facing a data breach, all your data will stay encrypted and inaccessible without your private encryption keys.
#3. Highly Scalable Architecture
When adopting new technology, the second thing that you should take into consideration after quality is scalability. If you’re planning to adopt a long-term data solution, it should be one that allows you to seamlessly scale without obstacles.
BigQuery’s architecture has all the necessary tools and capabilities to scale according to your requirements. Its processing power supports impressive scaling up to hundreds of petabytes, which allows for storing and querying data on a large scale.
Parallel computing and an elastic storage engine that scales smoothly also help keep BigQuery’s performance and scalability stable.
This scalability comes at a reasonable price because users are only charged for the resources they use, not the ones they deploy.
#4. Real-Time Data Ingestion and Analytics
One of the utmost capabilities of BigQuery is the fact that it can perform real-time data analysis which is much needed to get the latest insights. By being able to run queries on the data as it changes, you can discover important events and take measures immediately.
BigQuery’s machine learning service also has the ability to do analytics in real time. By integrating its high-speed streaming insert API, you’ll have an advantage over competitors who might not be able to analyse data as it changes.
#5. Flexible and Reasonable Pricing Model
The BigQuery pricing model leaves plenty of room for flexibility and resource loading. You can load, copy and export data for free onto the platform. The only operations you’re charged for are storing and querying data. This leads us to their pricing options, which are flat-rate subscriptions ($10,000 per 500 slots) or on-demand ($5 per each TB/mo).
Both storage and computational resources have different pricing, and you can choose which one works best for you based on your needs. Since both resources are priced differently, you can find out which one is more efficient for you using Google’s calculator.
Why Should You Start Using BigQuery
If you already use data warehousing services, you might be wondering: why use BigQuery? Well, if the above-mentioned features weren’t enough, here’s what else BigQuery is good at:
- Enhanced Insights. Once you’ve set up BigQuery, you’ll be able to access a detailed view of the connected or uploaded data. From there you can integrate other tools like Looker Studio and Tableau to turn your data into charts, reports, or other formats.
- Ease of Use. The principles of BigQuery are pretty simple. Instead of spending time building a data warehouse from scratch, you only have to connect your data sources with BigQuery and pay only when you use it.
- Reduced Time to Insights. Most BigQuery alternative solutions require time for the hardware and software to be fully installed. BigQuery is a fully managed and serverless solution which is instantly ready to use, allowing you to get started working on your data immediately.
As we’re going through our BigQuery tutorial, you’ll discover even more benefits of Google’s solution.
BigQuery Tutorial: Data Structure
Understanding BigQuery’s data structure is one of the fundamental steps to getting started with it. It consists of four layers, which are:
- Projects. This is the first category that serves as a container for your Google Cloud Platform data.
- Datasets. These are subcategories within projects that allow you to further categorise data.
- Tables. As the name suggests, tables allow you to organise and store data in columns and rows.
- Jobs. These are the queries that you execute via your console and are stored as jobs.
Here’s a visual representation of these elements on BigQuery:
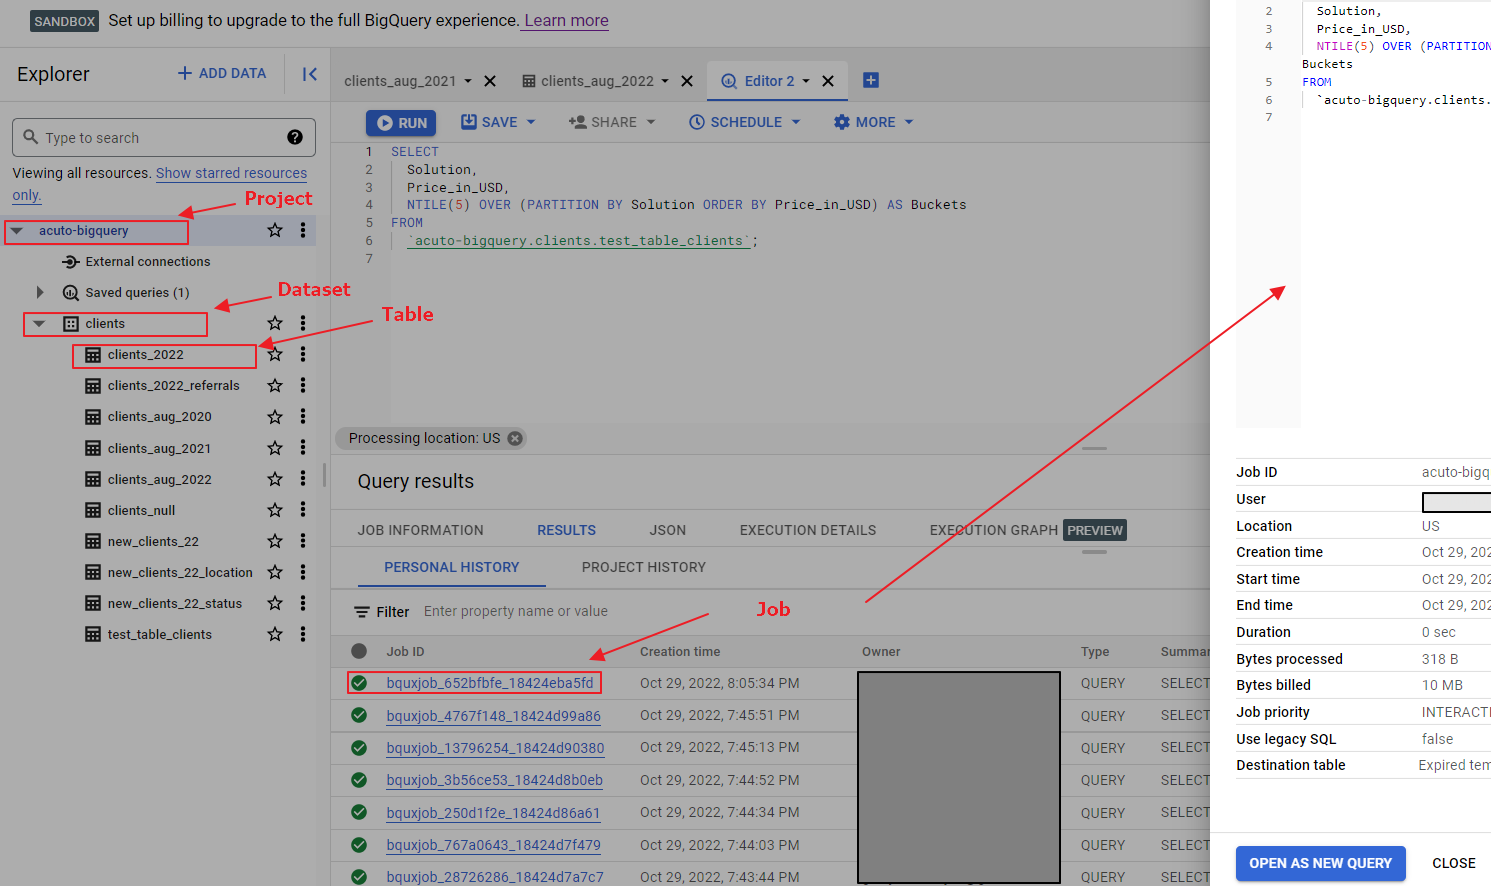
Let’s go more in-depth into each of these elements.
BigQuery Project
Imagine BigQuery as an office cabinet full of documents. In that case, office drawers are like BigQuery projects; folders are datasets; files are tables; and each document in them is a job. So projects stand at the top of the BigQuery data structure hierarchy. Projects have assigned IDs and names, which makes them easy to find, access, and modify.
Naming in BigQuery should be done based on certain formatting rules. For instance, names should be in either uppercase or lowercase letters, use ASCII values, hyphens, and digits, and not exceed 1,024 characters or include spaces. In order to start a new project, you can either click “Add Data” on the BigQuery left bar or use the bq command, among other methods. Here’s an example:
| gcloud projects create PROJECT_ID |
BigQuery Dataset
The second subset of the BigQuery data structure are datasets, where your data can be stored in the form of tables. Creating a dataset is essential to start uploading data to BigQuery. As Google defines them, datasets are “top-level containers that are used to organise and control access to your tables and views.”
Note that there are several ways to create a dataset, including:
- Writing an SQL query.
- Copying another existing dataset.
- By using client libraries or calling the datasets.insert API method.
- Through the bq command-line tool, by using bq mk “dataset_name”.
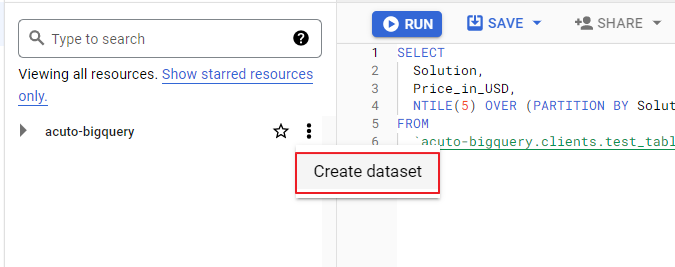
- Directly via Google Cloud Console (click the three dots to the right of your project name).
The last method is simple and easy:
BigQuery Table
Tables are the next component we find in the BigQuery architecture. In tables, you can start inputting data into rows and columns. These tables are structured according to a certain schema, which describes the data types, columns and their names.
As a user, you can create three types of tables in BigQuery:
- Views: Virtual tables created using SQL queries that help you control the column level access.
- Native Tables: The main type of tables containing data that is stored in the BigQuery storage.
- External Tables: Tables containing data that is stored on other platforms like Google Drive, Bigtable, or Cloud Spanner.
There are several ways to create tables too, but some of the easiest ones are:
- Writing a data definition language (DDL) statement (CREATE TABLE …).
- By using client libraries or calling the tables.insert API method.
- Creating a new table while loading data.
- Through the bq command-line tool by using the bq mk command.
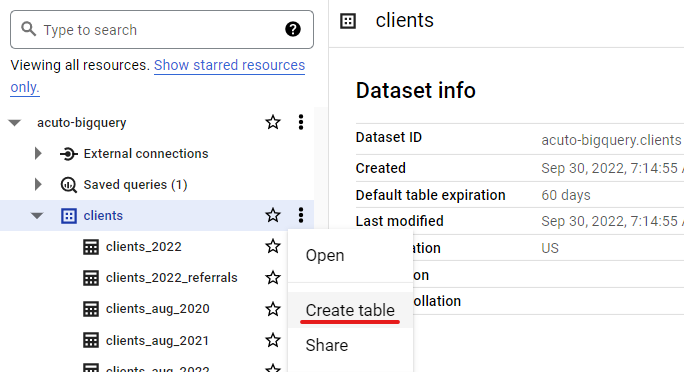
- Directly via Google Cloud Console (click the three dots in your dataset name).
BigQuery Job
After creating tables in your BigQuery project and populating them with data, it’s time to run queries on these tables and extract the right data that you need. The operations we’re able to perform on our data are referred to as “jobs.” Jobs are of four types:
- Loading
- Querying
- Exporting
- Copying
Each time you run one of these tasks, you’re creating a BigQuery job.
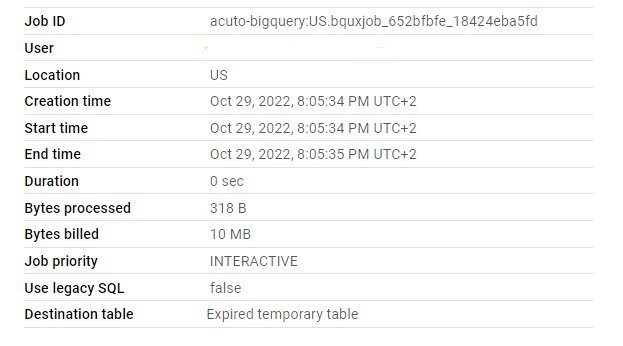
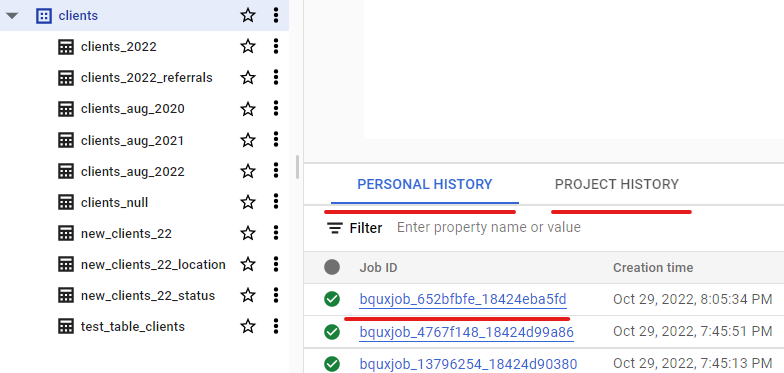
Getting information about your jobs is pretty straightforward, as you can see them below your queries in the Project History or Personal History tabs. But if you find the bq command-line more practical, this command will fetch more detailed information about the jobs you’ve run:
| ls -j project_id |
BigQuery Tutorial: How to Get Started
When you first start out with BigQuery, it might feel intimidating. As a beginner, you might run into some error messages when setting up connections or running queries, but don’t let that discourage you. Practice is the key to learning. That’s why in this BigQuery tutorial for beginners, we’re running some queries you can easily execute on your own.
Writing queries in BigQuery is no different from other SQL-based databases like Oracle and Netezza. You’re given multiple options to access and process data, such as through the BigQuery service APIs, Google Looker Studio, the bq command, and more. But fundamentally, learning to write functional SQL queries that return the right results is the basis of every process.
So without further ado, let’s jump into the Google Cloud Platform (GCP) and take the first step to working with BigQuery.
Step 1. Create a Google Cloud Platform Account
One great thing about BigQuery is that you don’t have to install any software or download any packages to your device. Since BigQuery is serverless, all you have to do is create an account on Google Cloud Platform, and start uploading your data into the cloud.
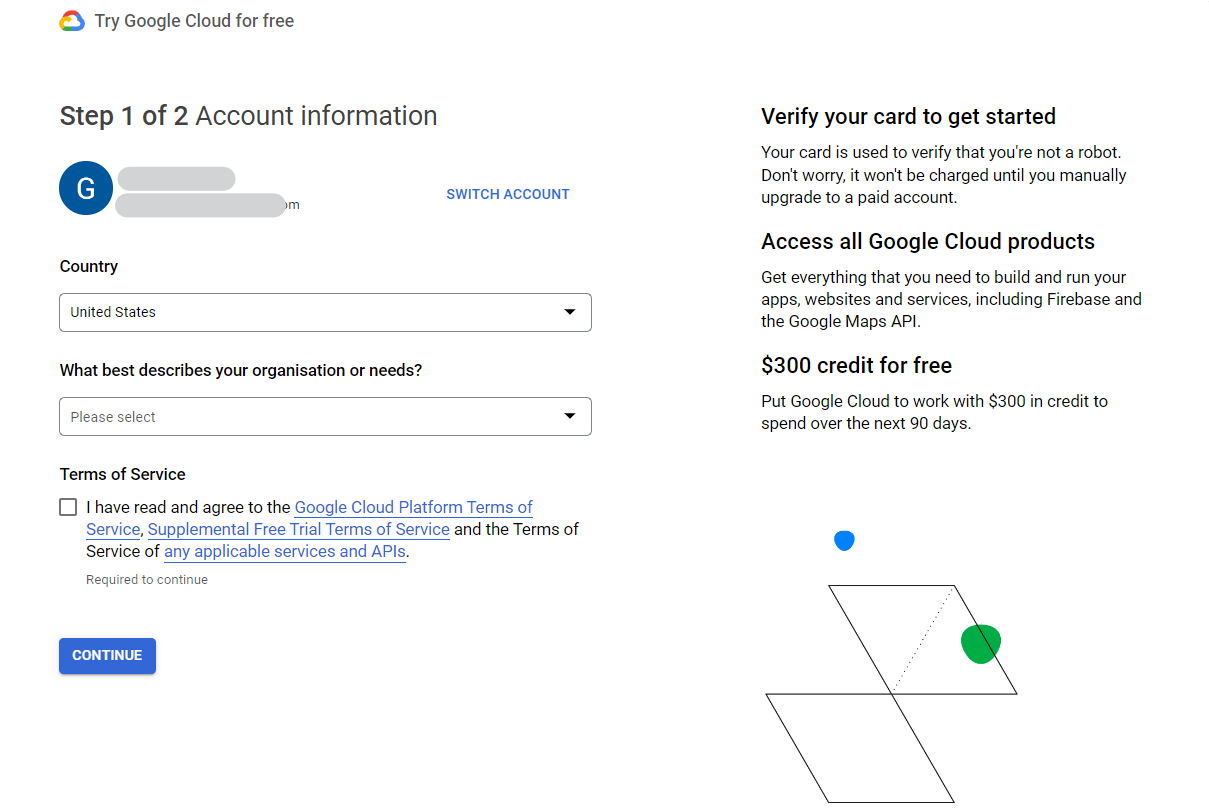
Upon signing up, you’ll have to select your country, choose what type of project you intend to use BigQuery for, and then add your credit card information to get started with the free trial.
As you can see in the sign up screen, registering for the free trial automatically rewards you with $300 in credits that you can spend on the platform after exhausting the free querying and storage limitations. (You can process up to 1 TB of data each month for free.)
However, in case you don’t want to use your credit card to simply run a few queries, you can use the BigQuery Sandbox. It has many of the features of BigQuery with only a few limitations, but it’s a great way to get started as a complete beginner with BigQuery.
Step 2. Open BigQuery and Create a New Project
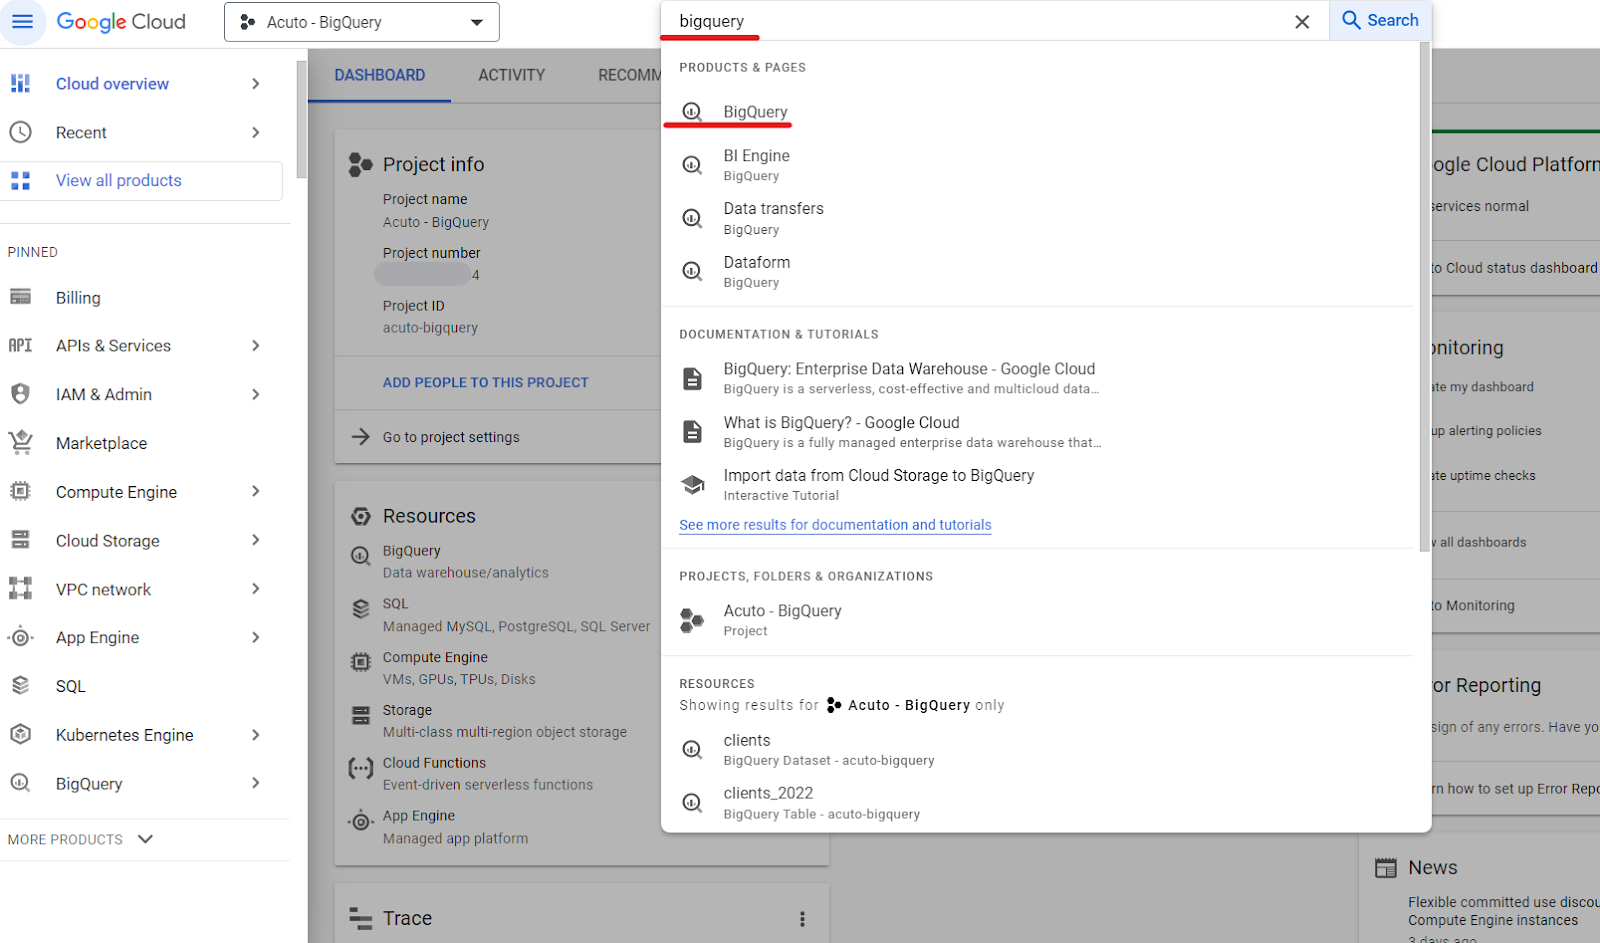
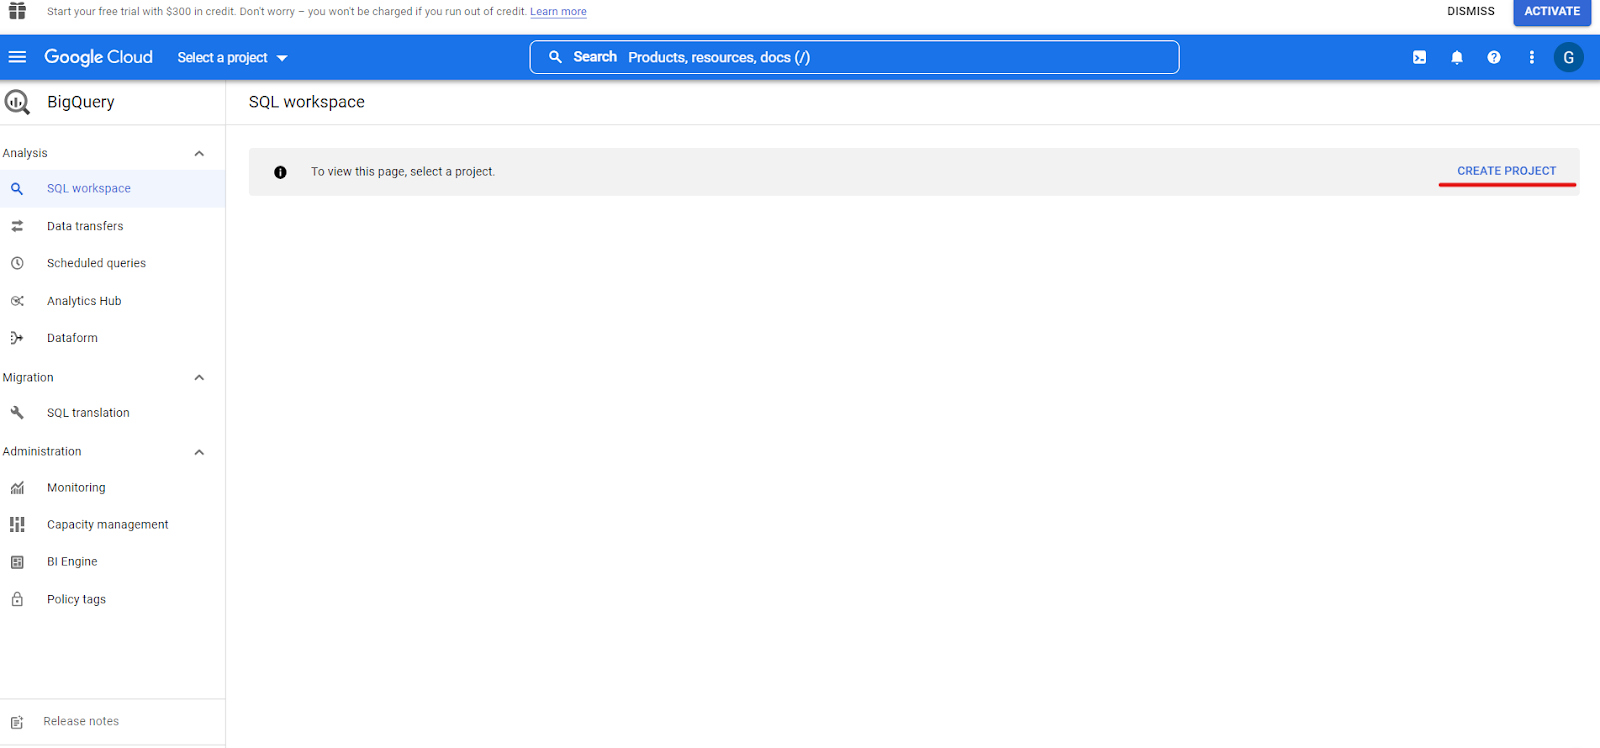
After registering on the Google Cloud Platform, you’ll see an interface with many functionalities. The one you are looking for is, of course, BigQuery. You can simply search and select BigQuery using the search bar, and you will be ready to start your first BigQuery project.
When you open BigQuery for the first time, it’ll be empty because you don’t have any projects yet. To create your first project, you should click on “CREATE PROJECT”.
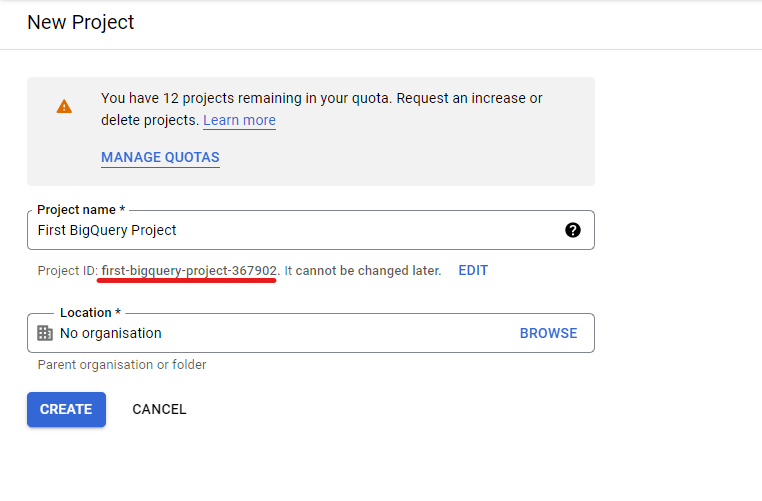
Now, you can Name your first project, select the location, and start your journey with BigQuery. One thing that you might notice is that the project name is automatically converted to lowercase letters, and words are separated with a hyphen. That’s because the project name should follow the naming conventions we mentioned above.
After you click “Create,” you’ll land on a different interface. This is the same SQL interface as before, but now you’re able to add data, create datasets and tables, and write queries.

Step 3. Run Your First Query
If you want to run a query in this project, you have to upload data into BigQuery or simply query one of the public datasets provided by Google. There are several public datasets, but for this example in our BigQuery tutorial, we’ve selected the Wikipedia dataset, which contains information about all the articles that were revised up to April 2010.
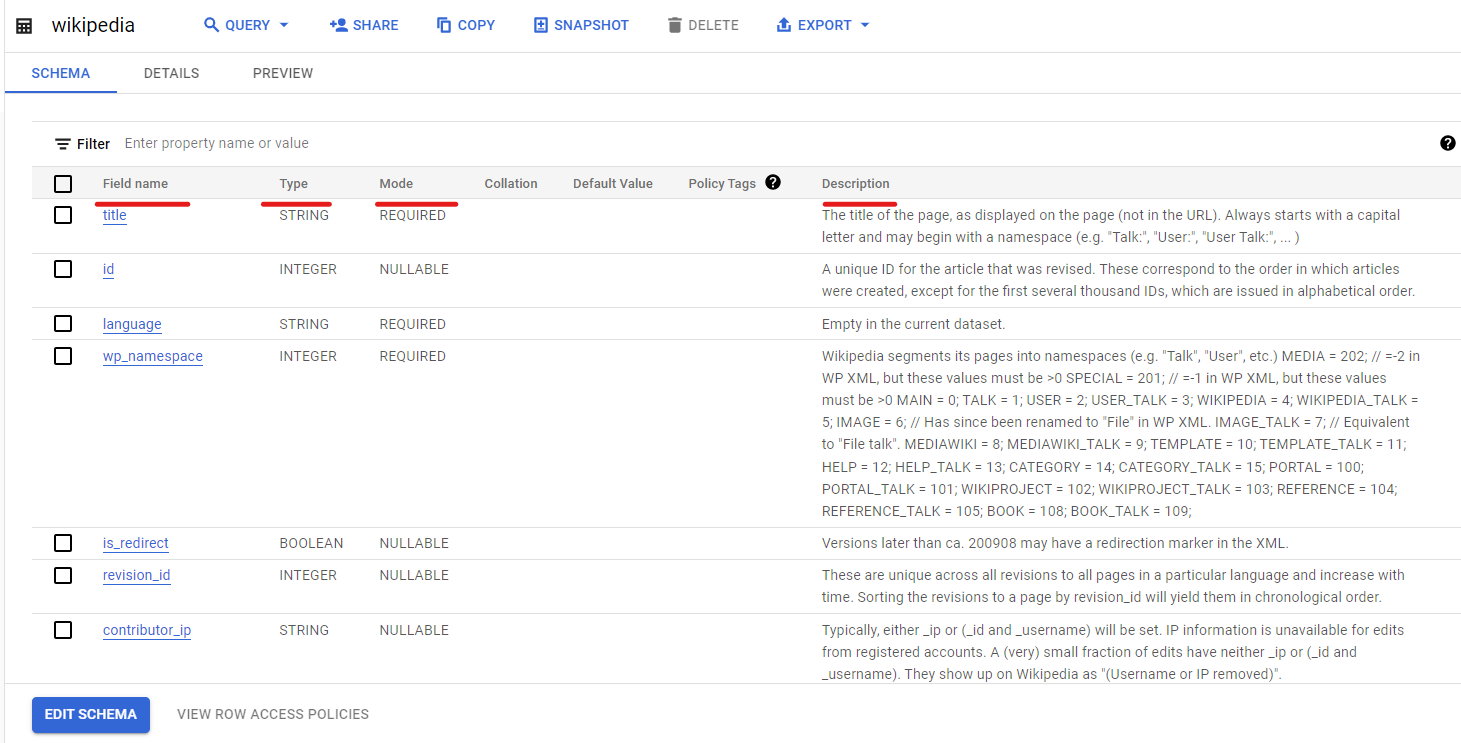
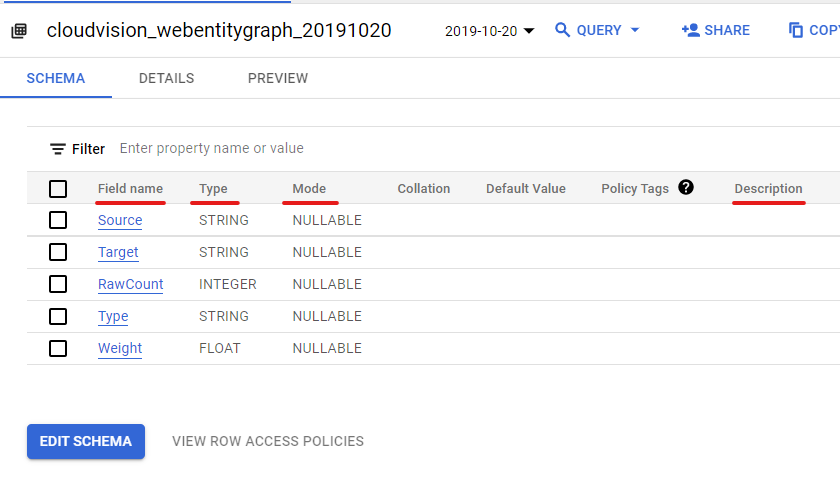
First, you should take a look at the schema of the table so that you understand what each column is about.
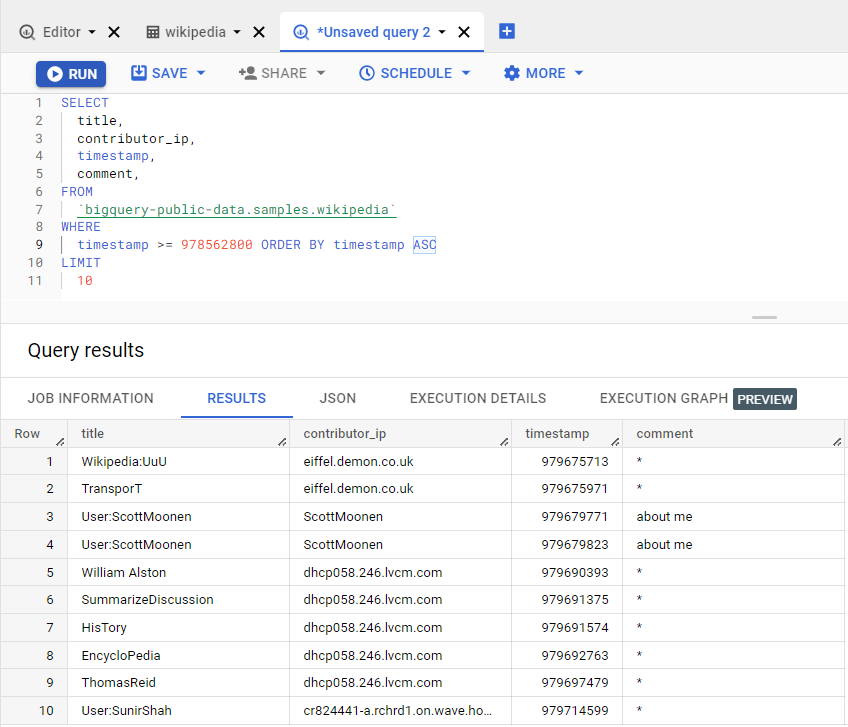
Then, let’s write a query that will fetch the first ten articles that were revised on January 4th, 2001, as an example in our BigQuery tutorial. Our query would look like this:
| SELECT title, contributor_ip, timestamp, comment, FROM `bigquery-public-data.samples.wikipedia` WHERE timestamp >= 978562800 ORDER BY timestamp ASC LIMIT 10 |
| Note: The timestamp column stores the date and time in the UNIX datetime format, which counts the milliseconds from January 1, 1970, 00:00:00 (UTC) until the chosen date. To simplify our query, we converted January 4, 2001 into this format. |
Now, let’s run the query and see which articles were revised on this date:
BigQuery Tutorial: Creating Your First Table
Raw data is stored in tables in BigQuery, as we talked about in our BigQuery tutorial, so knowing how to create tables is essential.
We’ve made a table in Google Sheets to use as an example in our BigQuery tutorial, and we want to add it to our BigQuery project.
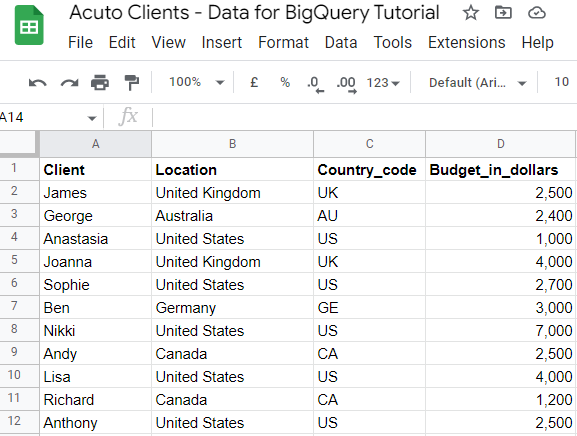
Step 1: Prepare Data to Extract
Our table has structured data that is formatted and organised in columns, and it’s ready to be uploaded into the BigQuery platform.
Then, there are two ways of querying this table in BigQuery: we can either connect the table from Google Drive as an external table or upload the table in CSV format. The second is more suitable since it lets us modify the schema more easily.
Step 2: Add Data to BigQuery
Regardless of the source of data you have chosen, the first step is to upload a table to BigQuery by clicking “Add Data.” Here, you will see all the possible options:
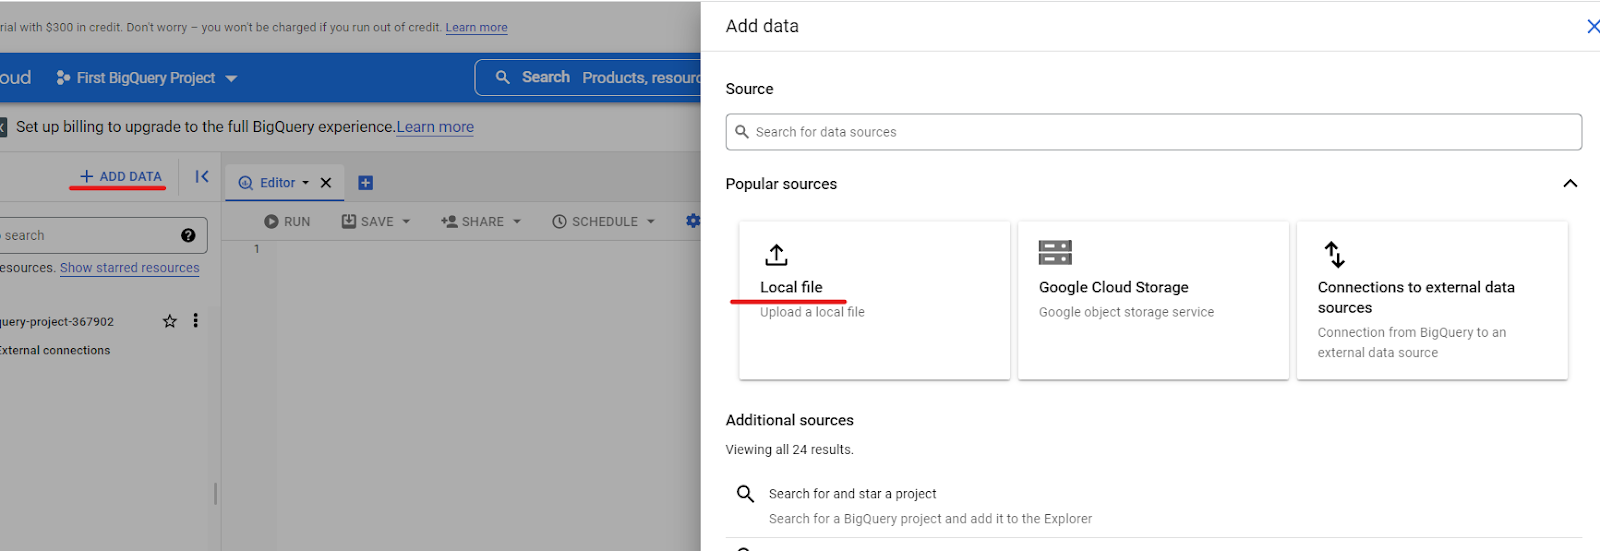
Select “Local file” if you have the data in your local storage, as we are doing in this example in our BigQuery tutorial.
Since we haven’t created a dataset within our project, we’re asked to create it now when we attempt to upload data. We fill in the details and set the table name:

Step 3: Complete the Schema
In this example, there are two ways to create a schema for our tables: we can either generate the schema by scanning the first row of the table or create it manually. We’ve found the second option to be more useful since we can add more details, such as a description, without having to edit the schema a second time. But both ways will work.

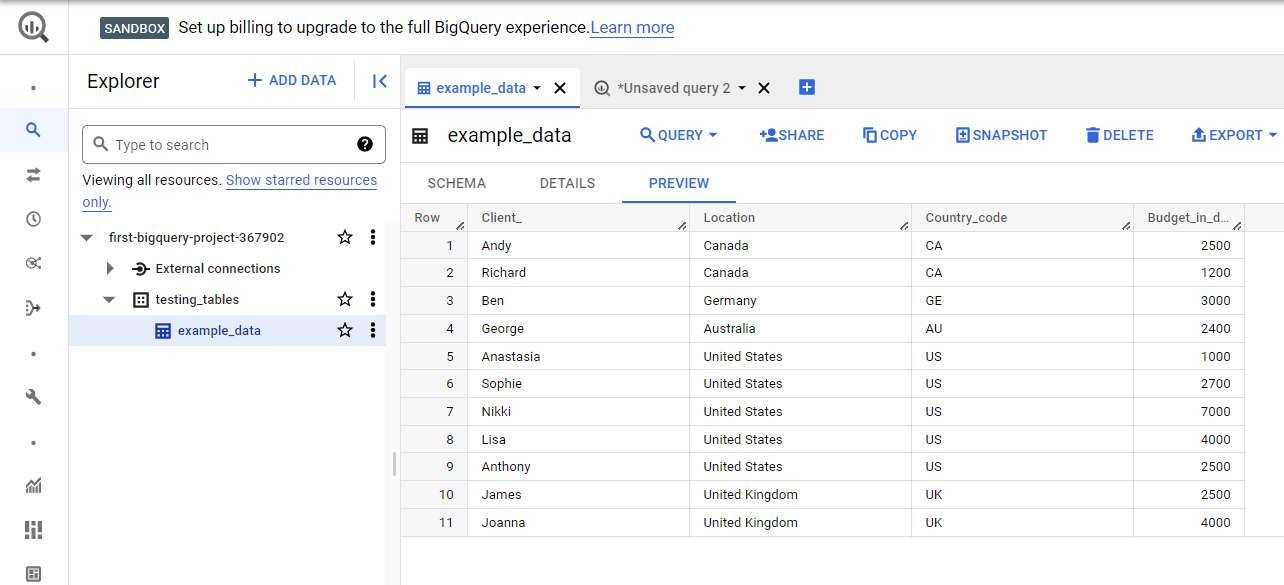
As a result, we’ve finally uploaded our first table into BigQuery, and we can run queries on it to extract the data we want.
BigQuery Tutorial: How to Visualise a Dataset
One of the primary reasons why BigQuery is such an important tool for businesses is that it seamlessly integrates with tools like Looker Studio (formerly Data Studio) to visualise massive amounts of data and transform them into eye-pleasing comprehensive graphics.
Let’s explore how we can visualise data in Looker Studio and find ways to present it in a useful manner.
Step 1. Select a Dataset to Visualise
The first thing is to select your data source. If you choose a table with structured data and few NULL values, you can be sure that the charts you make will be useful.
BigQuery and Python also work very well together for storing and visualising data. But for this example, we’re using the table we created above with client data.
Step 2. Run a Query for the Results You Aim to Display
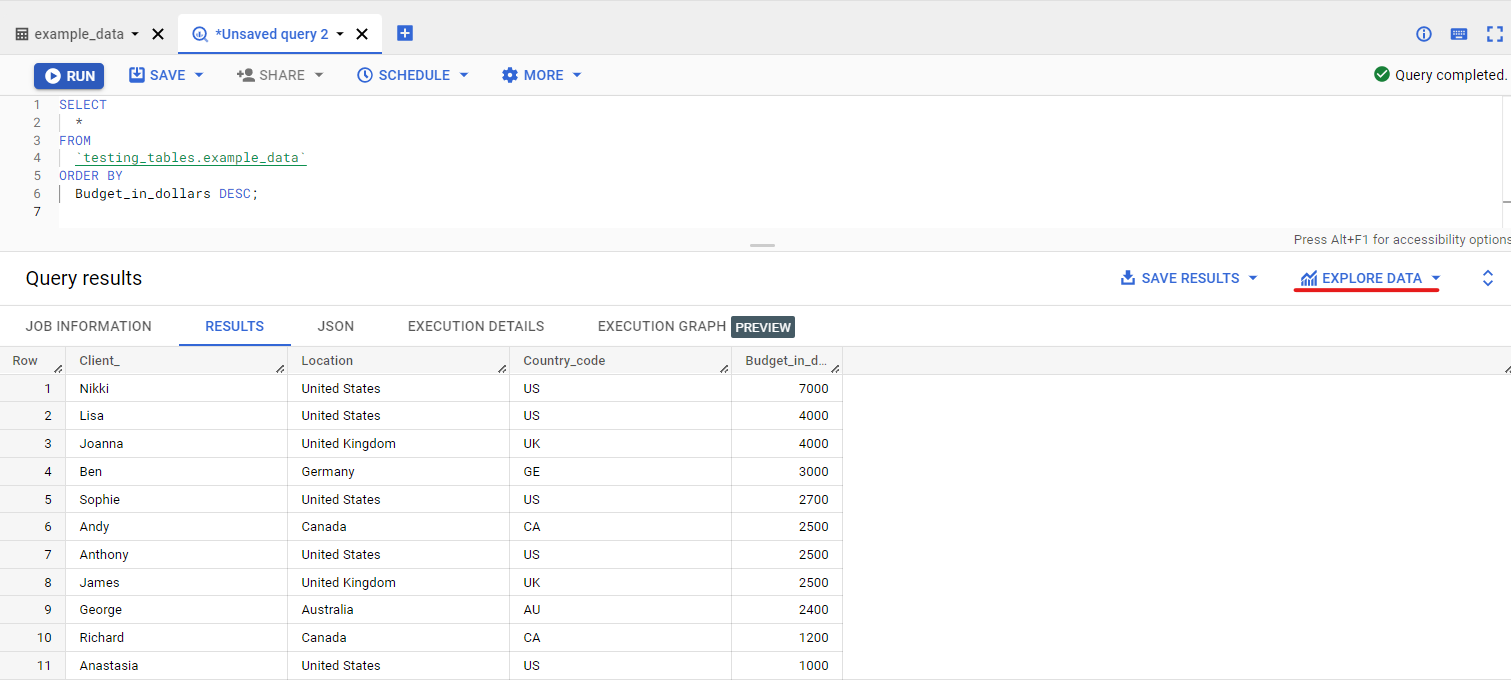
Our second step is to write a query that returns the results we want to visualise. Since our table is pretty small, we’re going to run a query that returns all the information about our clients but ranks it according to the budget column, from highest to lowest:
| SELECT * FROM `testing_tables.example_data` ORDER BY Budget_in_dollars DESC; |
Once the query is finished running, simply click “Explore.”
Step 3. Open Looker Studio and Choose the Right Charts
After clicking “Explore,” you’ll have more than one option to select from:
- Google Sheets
- Looker Studio
- Colab Notebook
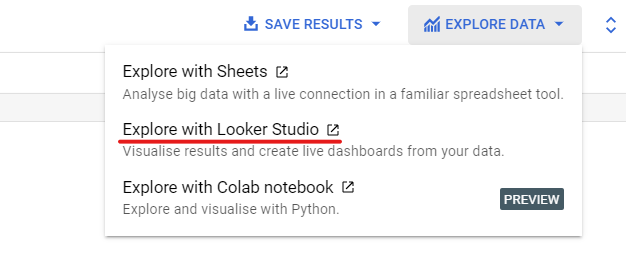
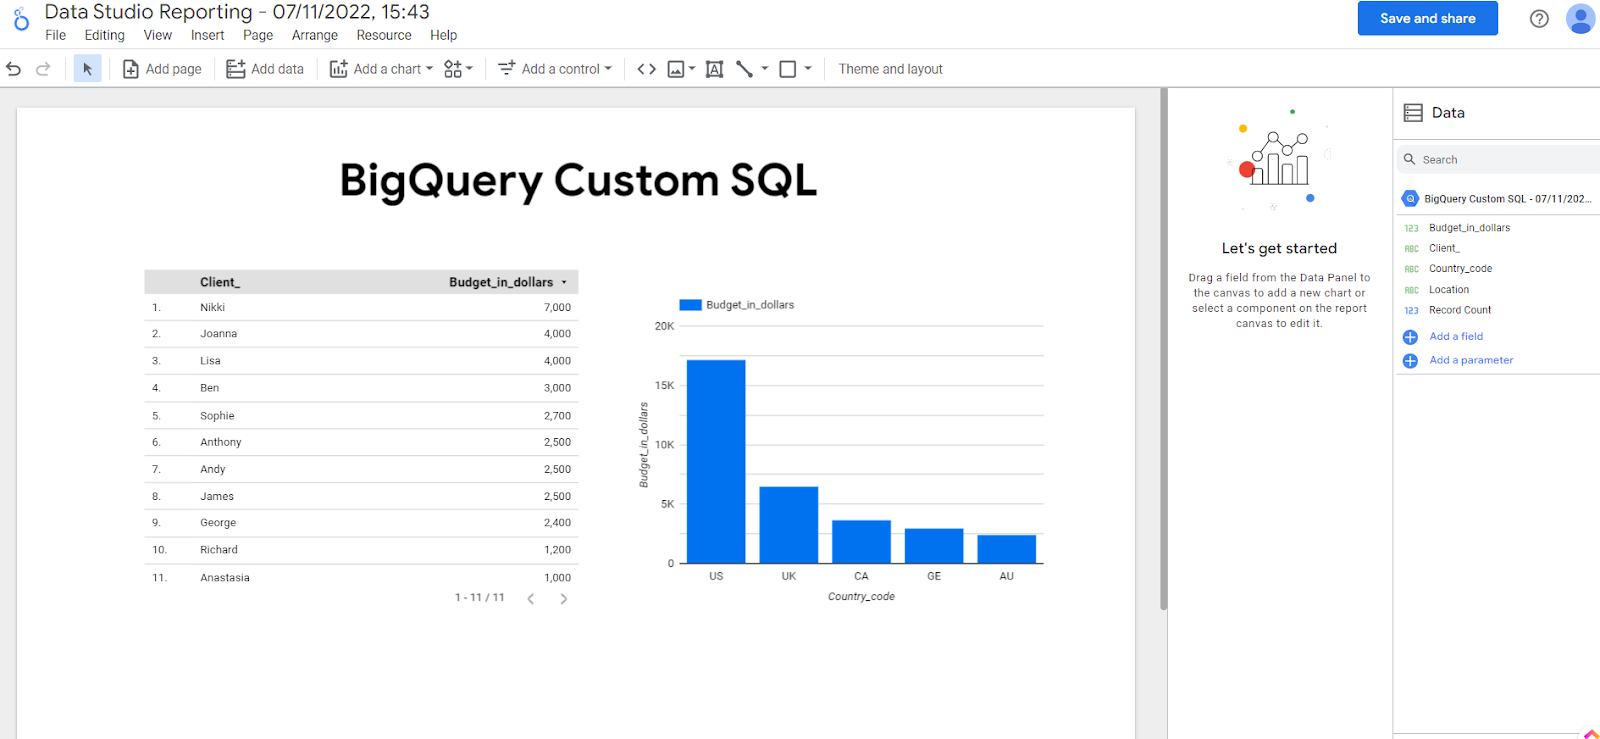
Select “Looker Studio,“ and then a new tab with the visualised data will open in Looker Studio. These are just randomly generated charts, but you can tweak them as much as you want by selecting which columns you want to add or remove, by deleting or adding charts, and more.
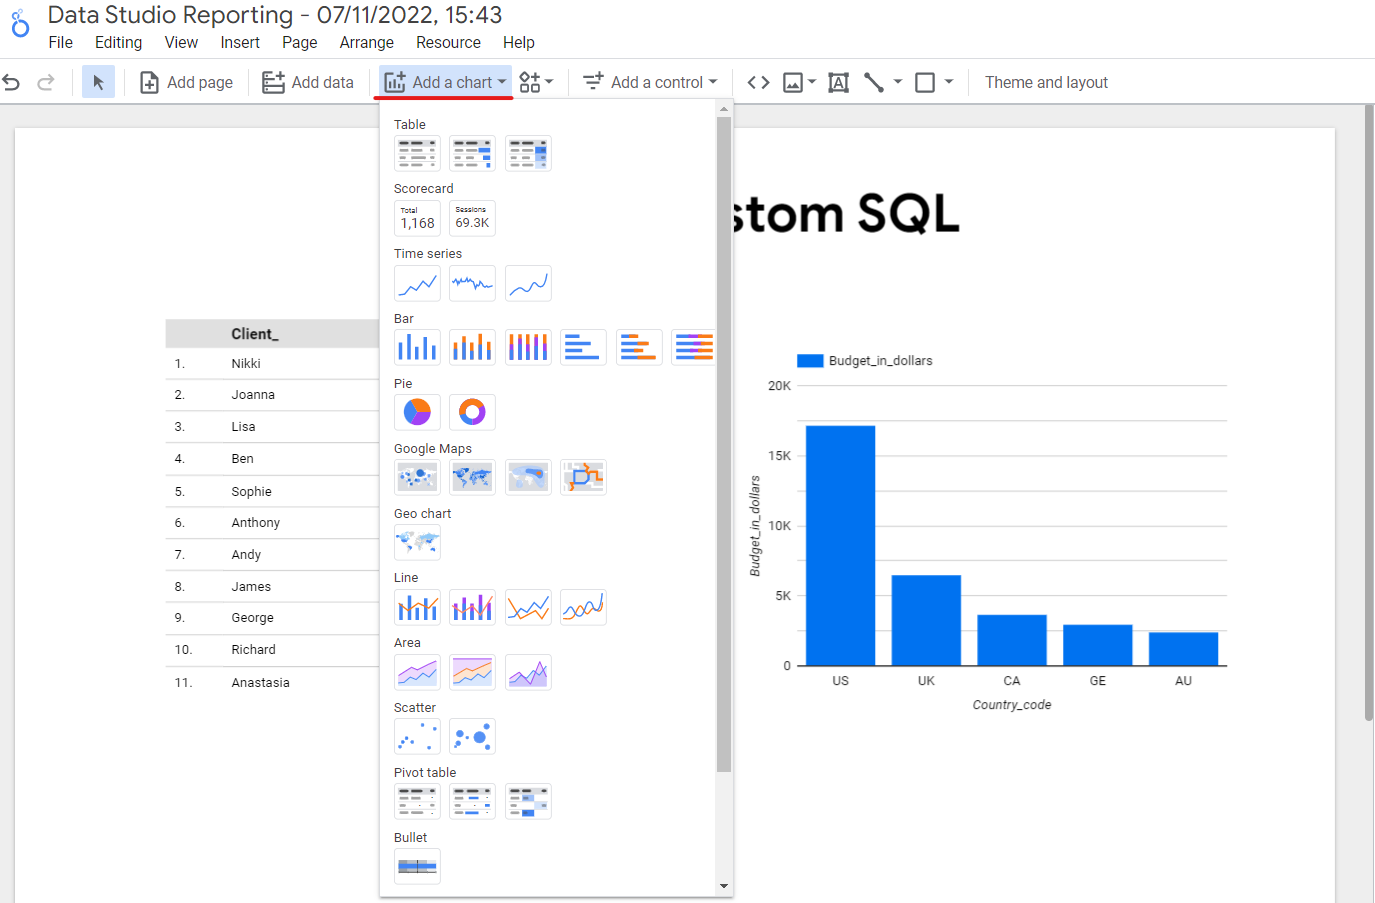
For instance, we can choose to display this data using pie charts to find out the dominant demographics of our clients. By clicking the “Add a chart” function, you can come up with some nice looking graphs and charts to visualise your data.
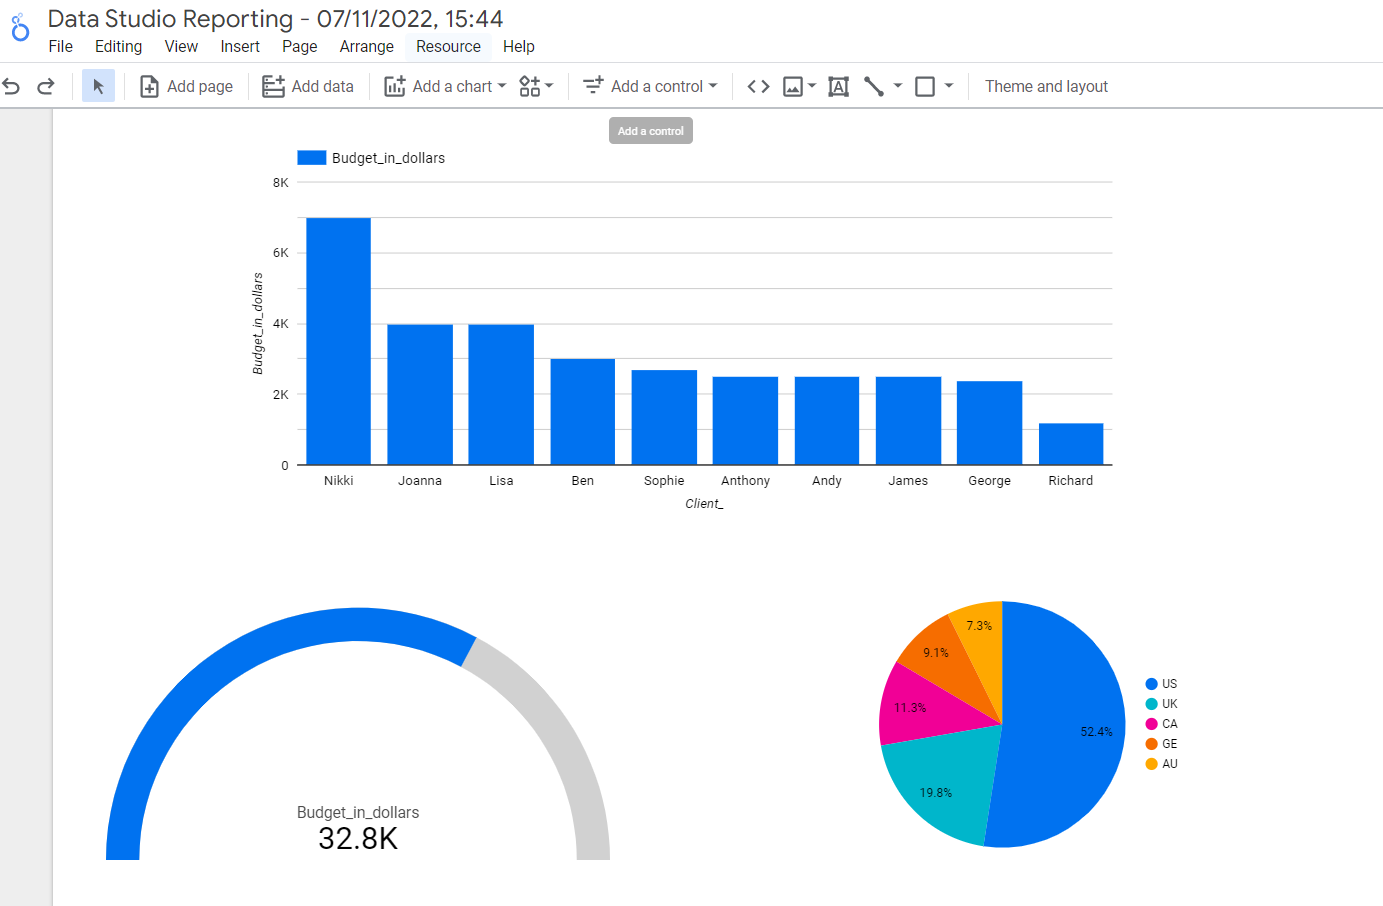
Here are some creative and useful ways in which we can display our data:
How Does BigQuery Store Data?
BigQuery stores data in a column-oriented format. When scanning columns across a whole dataset, this way of storing data is very efficient. Column-oriented databases are highly compatible with analytic workloads concerned with the aggregation of data over a substantial number of records.
If your data is stored in a row-based database, analytical functions are much less efficient because the system has to search through all the fields until it finds the right record.
When you store data in BigQuery, on the other hand, each column is kept in its own separate file block. Because of this format, BigQuery’s data warehouse architecture has a high throughput, which is very important for online analytical processing (OLAP).
BigQuery vs Snowflake vs Redshift
So far, BigQuery essentially wins over traditional relational databases, but what about other solutions that also rely on column-oriented architecture? Let’s compare three of the most similar data warehousing solutions on the market: BigQuery, Snowflake, and Redshift.
| Features | BigQuery | Snowflake | Amazon Redshift |
| Architecture | Serverless | Hybrid (architectures is made of shared-disk & shared-nothing) | Shared-nothing (provisioned clusters & nodes) |
| Table column limits | 10,000 | 16,384 (for only-numeric data the limit lowers to 7,480) | 1,600 |
| Table Updating System | Data Manipulation Language | Data Manipulation Language | Staging tables |
| Manageability | No configuration necessary; fully managed service | No management needed from end users | After the infrastructure is configured, periodic management tasks need to be handled; hard to manage without an AWS architect |
| Ease of Scalability | Scalable; compute and storage remain separated | Scalable; Compute and storage are separated | Unable to scale independently the resources; requires local storage configuration |
Get Started on Your BigQuery Data Warehouse With Acuto
Scaling your business, regardless of the industry, depends on your capabilities to keep track of, transform, and visualise your data so that it leads to calculated business decisions. However, not all companies have the time and resources to properly manage their data.
At Acuto, we specialise in building data warehouses that not only store your data but are also customised for your business needs. The solutions we can build for you are less costly than the traditional data warehouses you find online, and we provide additional automation scripts, which save you time and money.
Our team of cloud engineers and developers can build a data warehouse for all of your data needs. As a marketing automation agency with expertise in PPC, we know how to help you optimise your marketing operations.
Stay on top of the trends and gather useful marketing insights as they happen without worrying about dispersed data. Reach out to our team and book a call today to see how our solutions can deliver results for your agency.
BigQuery Tutorial Key Takeaways
Data is the ultimate driving force behind every business, and adopting the right data solutions can build stable growth for your company. BigQuery remains one of the best data warehousing solutions that you can start using today if you want to manage your data efficiently.
Some of the key reasons behind the adoption of BigQuery are:
- Lighting speed processing power
- Highly secure and very scalable architecture
- Real-time analytics capabilities
- Affordable pricing
Start by following this BigQuery tutorial to learn the basics. Or, skip all the hard work of learning to work with BigQuery and hire experts to build and manage a data warehouse for you. Get in touch with us today!